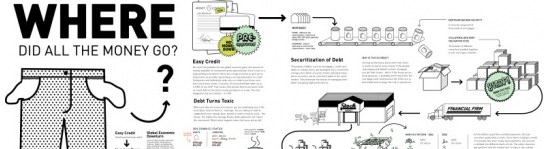
Ik ben een sucker for infographics. Hier 27 infographics die de crisis uitleggen van de flowing data site
Bonus link: Cool Infographics blog
(via Nettooor)

Ik ben een sucker for infographics. Hier 27 infographics die de crisis uitleggen van de flowing data site
Bonus link: Cool Infographics blog
(via Nettooor)


Grab the RSS feed for Free Updates!
(What's this? — Learn more about RSS)
Copyright © 2024 ferket.com – Nodesktophero, Hosting by Edge.be from Antwerpen
Powered by the sexy Thrilling Theme 
Jos Vorkmans | 16 March 2009
Topics: Design